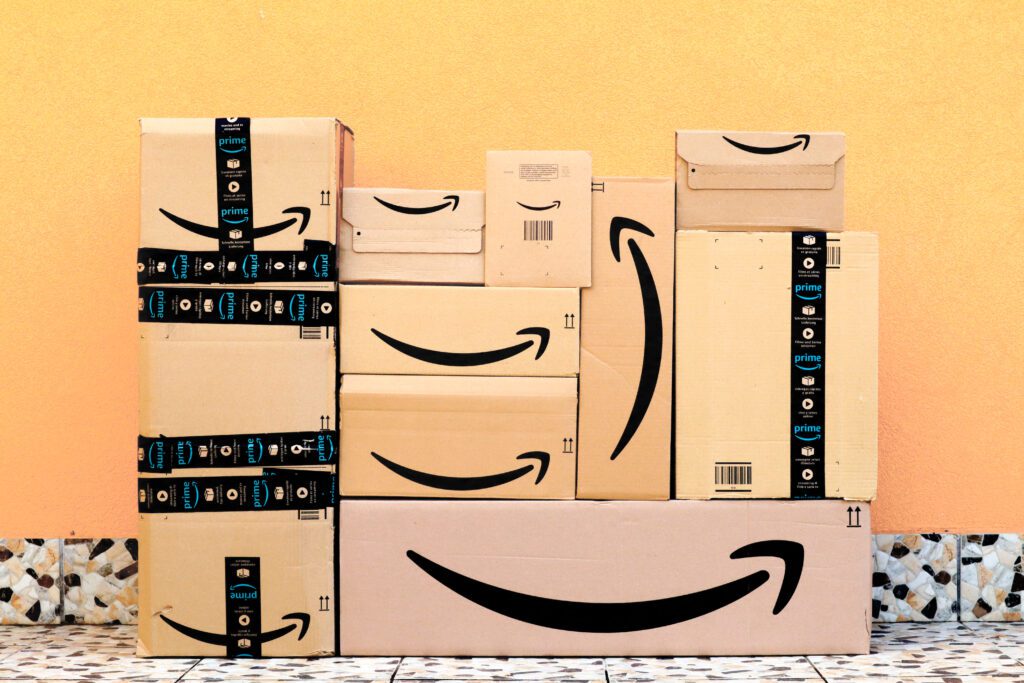
Amazon’s 2023 Prime Day sales wrapped up on July 12, and day two largely played out like day one, based on early reports.
Amazon ranks No. 3 in Digital Commerce 360’s new 2023 Global Online Marketplaces Report, and the annual Prime Day sale draws millions of shoppers.
Prime Day set a new record
Consumers spent $6.3 billion across U.S. ecommerce on the second day of the sale, according to Adobe Analytics data of 1 trillion visits to U.S. retail sites and 100 million SKUs. That’s up 6.4% year over year. Spending was down slightly from day one of the sales event, which reached $6.4 billion.
Total sales for the two-day event were $12.7 billion, a new record from Prime Day, per Adobe. That’s an increase of 6.1% over $11.9 billion in sales in 2022. However, it’s below Adobe’s expected growth rate of 9.5%.
Amazon called out the first day of the promotion as its biggest sales day in company history.
Consumers shopped for appliances and home goods
Amazon Prime shoppers focused their spending on items for their homes. Appliance sales were up 52% compared to the average day in June, according to Adobe. Housekeeping supplies and apparel were also popular, up 27% and 24%, respectively.
“In an event typically dominated by electronics, we instead saw many shoppers stocking up on everyday essentials like pet food or pantry staples,” Numerator analyst Amanda Schoenbauer said in a statement. “It seems many used the event to save on their standard purchases or held off on buying larger-ticket items until the sale came around.”
Amazon said in a press release that home, fashion, and beauty were top-selling categories. The single best selling product was the Fire TV Stick (3rd Gen) with Alexa Voice Remote.
Data research company Numerator gathered Prime Day information based on more than 98,000 orders, 34,000 buyers and more than 172,000 products. 52% of consumers told Numerator that they held off on buying certain items until they were discounted on Prime Day.
Home goods (28%) and household essentials (26%) were the top categories in Numerator’s data, followed by apparel (24%) and electronics (21%).
Stationery and office supply purchases were up 76%, according to Adobe, as consumers started looking for back-to-school deals.
How Prime Day consumers shopped
The average Prime Day order was $54.05, up slightly from $52.26 in 2022, Numerator found. 65% of households that shopped the sale made at least two separate orders, with an average household spending $155.67. Nearly one in five households (18%) made five or more orders.
Just under half of orders on July 12, 45%, were made on smartphones, Adobe said. That’s up from 41.5% of orders in 2022. Adobe attributed the increase to growing consumer comfort shopping on mobile devices, and the ease of making impulse purchases.
Buy Now, Pay Later (BNPL) played a much bigger role on Prime Day
On day one of the sale, 6.4% of all orders were made using buy-now-pay-later (BNPL) services, per Adobe. Those orders drove $461 million in revenue, up 19.5% from the first day of the sale in 2022. On July 12, BNPL made up 6.6% of online orders for $466 million in revenue, up 21% year over year. For both days, BNPL was used in 6.5% of orders, generating $927 million in revenue, which is up 20% from 2022.
“For months, consumers have felt the effects of persistent inflation and an uncertain economic environment, and it has pushed shoppers to embrace more flexible ways to manage their spending around the Prime Day event,” Adobe analyst Vivek Pandya said in a statement. “The revenue growth attributed to buy now, pay later is a preview of what we can expect in the months ahead, especially as we near the holiday shopping season.”
BNPL was used most in the apparel, furniture and electronics categories, Adobe said.
Beyond Amazon
More than half of Prime Day shoppers (54%) compared prices at competitors, many of whom were also holding sales events, according to Numerator. 36% checked Walmart for prices, and 25% consulted Target. 37% of shoppers said they did not look at any other sales.
Consumers that did look beyond Amazon chose curbside pickup in slightly greater numbers than in the past. 20% of orders from retailers that offered the service used it on July 12, up slightly from 19% in 2022, according to Adobe.
Do you rank in our database?
Submit your data and we’ll see where you fit in our next ranking update.
Sign up
Stay on top of the latest developments in the ecommerce industry. Sign up for a complimentary subscription to Digital Commerce 360 Retail News.
Follow us on LinkedIn, Twitter and Facebook. Be the first to know when Digital Commerce 360 publishes news content.
Favorite