Key Ecommerce Statistics on Jewelry Category – Snapshot
Jewelry
Jewelry Ecommerce Statistics
 |
 |
 |
Jewelry Sold Well Online
2022 proved to be a good year for ecommerce merchants in the jewelry category. Despite the waning of the pandemic – and the resulting return to brick and mortar stores by shoppers – jewelry sold well online. The conversion rate rose to 1.9% from 1.8% in 2021. That’s a modest rise, but when combined with other metrics, it points toward a prosperous year.
The median ticket price in the category soared by more than 21% to $326 from the $269 seen in 2021. Even in a period of inflation, a jump like that can’t be explained solely by higher prices.
Median monthly unique users stood at 333,017 in 2022, a rise of 6.9% from the 311,634 median monthly unique users of 2021.
     |
  |
Web Sales Rose for Jewelry Retailers
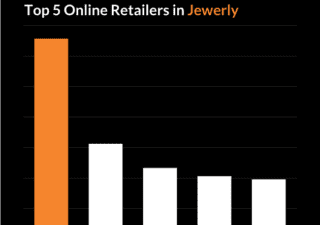
There are 41 jewelry retailers in the Digital Commerce 360 Top 1000. And most of them saw higher sales in 2022. Of the five largest jewelry retailers, only one (Fossil Group Inc., No. 237 in the Top 1000) saw Web sales decline last year.
The Top 1000 online share of total category retail sales climbed to 14.4% in 2022.
     |
Overall Top 1000 category sales rose 5.4% in 2022 to $5.63 billion in 2022. That’s more than double the 2.6% growth rate of overall digital and brick-and-mortar sales in jewelry last year, according to a Digital Commerce 360 analysis of U.S. Department of Commerce data.
  |
     |
  |
Young Shoppers Dominate Online Jewelry
It appears the jewelry category has fans across all demographics. But the lion’s share of purchases are made by the young.
Nearly half – 48.9% of shoppers who purchase jewelry from Top 1000 merchants are 34 years old or younger.
There are 34 jewelry retailers in the Next 1000 (those ranked 1001-1999 by Web sales) in the jewelry category. Shoppers among those retailers skew slightly older than in the Top 1000.
46.5 of Next 1000 shoppers are 34 or younger. Some 7.8% of the Next 1000 jewelry shoppers are 65 or older. That’s a full percentage point higher than the median age among Top 1000 shoppers.
  |
  |
  |
1. Digital Commerce 360 analysis of SimilarWeb traffic data. 2. Includes only U.S. sales from the sites of U.S.-owned retailers for consistency with the U.S.
Department of Commerce’s methodology. 3. Digital Commerce 360 category estimate for 2021 since the U.S. Department of Commerce didn’t break out the jewelry segment, which the Top 1000 considers a separate category rather than part of apparel/accessories; 2020 figure reported by the U.S. Department of Commerce 4. Medians won’t sum to 100%
Jewelry Category News Feed


